Сравнительное исследование
профессиональных 3D-акселераторов
в SPECviewperf 6.1.2:
март-апрель 2002 года
Исследование в SPECviewperf 6.1.2.
Итак, переходим к заключительной фазе нашего исследования. В этой части мы посмотрим на производительность
карт при работе с набором тестов под общим названием SPECviewperf.

Данный набор тестов был специально разработан для вычисления производительности видео подсистемы компьютера под управлением OpenGL. Каждый тест показывает вполне реальную работу карты, как если бы, она работала в реальном приложении.
Основные отличия этих тестов таковы:
- Все данные разрабатывались и используются в реальных приложениях
- Все параметры рендеринга и моделей разрабатывались независимыми производителями (independent software vendors (ISVs))и пользователями
- Результаты выводятся в общепризнанном количественном выражении: fps (frames per second)
Что же измеряют эти тесты? Я приведу полный список на английском языке, поскольку не уверен, что мой перевод будет адекватным, английские же термины достаточно понятны людям, работающим с ускорителями профессионально:
- 3D primitives, including points, lines, line_strip, line_loop, triangles, triangle_strip, triangle_fan, quads and polygons;
- attributes per vertex, per primitive and per frame;
- lighting;
- texture mapping;
- alpha blending;
- fogging;
- anti-aliasing;
- depth buffering
Что же, это на самом деле наиболее полный набор тестирования для профессионального ускорителя.
Теперь перейдем к исследованию. Я немного расскажу о каждом тесте и приведу результаты. После чего подведем итоги.
Advanced Visualizer Viewset

Первый тест — это Advanced Visualizer Viewset или сокращенно AWadvs-04. Вот описание данного теста на английском языке, так как я опять же не рискну переводить всё это на русский язык, боясь потерять смысл:
- Geometric, analysis, and motion data importation from a wide range of CAD, dynamics and structural systems.
- Automatic object simplification and switching tools for working with ultra-large production data sets.
- Motion for an unlimited number of objects, cameras, and lights with Wavefront SmartCurve editing techique.
- Interactive test rendering and high-quality, free-form surface rendering
- Software rotoscoping for matching computer animation with live action background footage.
- Realistic imaging effects, including soft shadows, reflection, refraction, textures, and displacememt maps, using Wavefront's fast hybrid scanline/raytracing renderer.
- Interactive image layering and output to video with Wavefront's new Recording Composer.
- Powerful scripting and customization tools, open file formats, and user-defined interfaces.
В этом тесте собрано 10 подтестов, если можно так выразиться. Вот что это значит:
| Test | Weight | Advanced Visualizer functionality represented |
|---|---|---|
| 1 | 41.8% | Material shading of polygonal animation model with highest interactive image fidelity and perspective projection. |
| 2 | 28.5% | Wireframe rendering of polygonal animation model with perspective projection. |
| 3 | 10.45% | Material shading of polygonal animation model with lowest interactive image fidelity and perspective projection. |
| 4 | 9.5% | Smooth shading of polygonal animation model with perspective projection. |
| 5 | 4.75% | Flat shading of polygonal animation model with perspective projection. |
| 6 | 2.2% | Material shading of polygonal animation model with highest interactive image fidelity and orthogonal projection. |
| 7 | 1.5% | Wireframe rendering of polygonal animation model with orthogonal projection. |
| 8 | .55% | Material shading of polygonal animation model with lowest interactive image fidelity and orthogonal projection. |
| 9 | .5% | Smooth shading of polygonal animation model with orthogonal projection. |
| 10 | .25% | Flat shading of polygonal animation model with orthogonal projection. |
И теперь давайте посмотрим на результаты нашего тестирования.
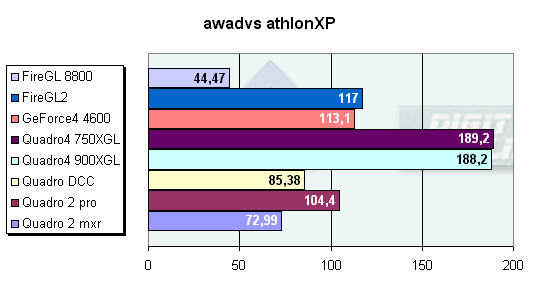
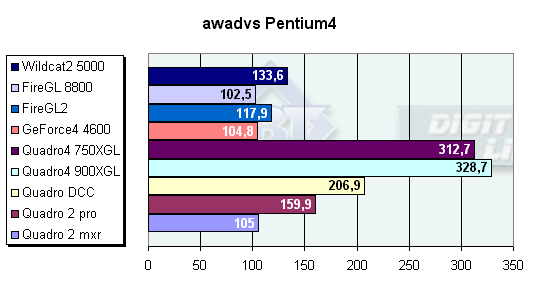
Явные лидеры в этих тестах — новейшие профессиональные ускорители от компании NVIDIA. Причем, на стенде Athlon XP Quadro4 750XGL несколько опережает свою старшую сестру, на мой взгляд, это из-за того, что производительность самого GPU зажата производительностью CPU системы. Диаграмма по стенду на Pentium 4 подтвержает это, и вы видите, как резко ушли вперед эти ускорители.
DesignReview Viewset
Второй набор тестов DesignReview Viewset или сокращенно DRV-07.
Вот описание этого теста:

DesignReview is a 3D computer model review package specifically tailored for plant design models consisting of piping, equipment and structural elements such as I-beams, HVAC ducting, and electrical raceways. It allows flexible viewing and manipulation of the model for helping the design team visually track progress, identify interferences, locate components, and facilitate project approvals by presenting clear presentations that technical and non-technical audiences can understand.

On the construction site, DesignReview can display construction status and sequencing through vivid graphics that complement blueprints. After construction is complete, DesignReview continues as a valuable tool for planning retrofits and maintenance. DesignReview is a multi-threaded application that is available for both UNIX and Windows NT.
The model in this viewset is a subset of the 3D plant model made for the GYDA offshore oil production platform located in the North Sea on the southwest coast of Norway. A special thanks goes to British Petroleum, which has given the SPECopcSM subcommittee permission to use the geometric data as sample data for this viewset. Use of this data is restricted to this viewset.
DesignReview works from a memory-resident representation of the model that is composed of high-order objects such as pipes, elbows valves, and I-beams. During a plant walkthrough, each view is rendered by transforming these high-order objects to triangle strips or line strips. Tolerancing of each object is done dynamically and only triangles that are front facing are generated. This is apparent in the viewset model as it is rotated.
Most DesignReview models are greater than 50 megabytes and are stored as high-order objects. For this reason and for the benefit of dynamic tolerancing and face culling, display lists are not used.
The updated DRV-07 shaded model contains 367178 vertices in 42821 primitives. Vertex arrays are used to send the data to mirror the current release of the Design Reivew application. The color and material changes are taken directly from the GYDA model. The wire frame model contains 1599755 vertices in 94275 primitives.
There are 5 tests specified by the viewset that represent the most common operations performed by DesignReview. These tests are as follows:
| Test | Weight | DRV functionality represented |
|---|---|---|
| 1 | 75% | Walkthrough rendering of surfaces. Each object is rendered as a triangle mesh, depth-buffered, smooth-shaded, with one light and a different color per primitive. Material properties are changed about once every 20 primitives. |
| 2 | 13% | For more realism, objects in the model can be textured. This test textures the model with linear blending and mipmaps. There is a color change per primitive and the material properties change as in test 1. |
| 3 | 4% | As an additional way to help visual identification and location of objects, the model may have "screen door" transparency applied. This requires the addition of polygon stippling to test #1 above. |
| 4 | 4% | To easily spot rendered objects within a complex model, the objects to be identified are rendered as solid and the rest of the view is rendered as a wireframe (line strips). The line strips are depth-buffered, flat-shaded and unlit. Colors are sent per primitive. |
| 5 | 4% | Two other views are present on the screen to help the user select a model orientation. These views display the position and orientation of the viewer. A wireframe, orthographic projection of the model is used. Depth buffering is not used, so multithreading cannot be used; this preserves draw order. |
И теперь давайте посмотрим на результаты нашего тестирования.

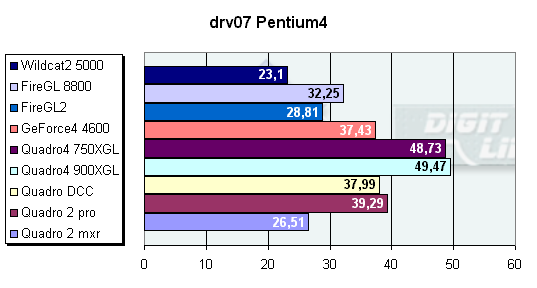
Лидеры не изменились по сравнению с первым тестом, по-прежнему Athlon XP сдерживает мощь ускорителей.
Data Explorer
Третий набор тестов Data Explorer или сокращенно DX-06.
Вот описание этого теста:

The IBM Visualization Data Explorer (DX) is a general-purpose software package for scientific data visualization and analysis. It employs a data-flow driven client-server execution model and is currently available on Unix workstations from Silicon Graphics, IBM, Sun, Hewlett-Packard and Digital Equipment. The OpenGL port of Data Explorer was completed with the recent release of DX 2.1.
The tests visualize a set of particle traces through a vector flow field. The width of each tube represents the magnitude of the velocity vector at that location. Data such as this might result from simulations of fluid flow through a constriction. The object represented contains about 3,000 triangle meshes containing approximately 100 vertices each. This is a medium-sized data set for DX.
Test Weighting
All tests assume z-buffering with one light in addition to specification of a color at every vertex. Triangle meshes are the primary primitives for this viewset. While Data Explorer allows for many other modes of interaction, these assumptions cover the majority of user interaction.
The first version of this viewset included indirect rendering to handle the client/server model of X-Windows-based systems. In this version, tests with indirect rendering have been removed to allow the viewset to be fully ported to Windows NT and OS/2 environments.

| Test | Weight | DX functionality represented |
|---|---|---|
| 1 | 40% | TMESH's immediate mode. |
| 2 | 20% | LINE's immediate mode. |
| 3 | 10% | TMESH's display listed. |
| 4 | 8% | POINT's immediate mode. |
| 5 | 5% | LINE's display listed. |
| 6 | 5% | TMESH's list with facet normals. |
| 7 | 5% | TMESH's with polygon stippling. |
| 8 | 2.5% | TMESH's with two sided lighting. |
| 9 | 2.5% | TMESH's clipped. |
| 10 | 2% | POINT's direct rendering display listed. |
И теперь давайте посмотрим на результаты нашего тестирования.

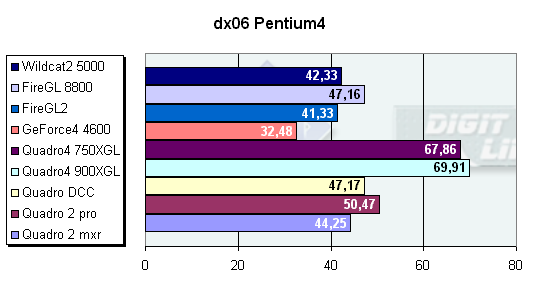
Картина не изменилась. Самая интересная борьба разворачивается между FireGL8800, Wildcat II 5000 и QuadroDCC.
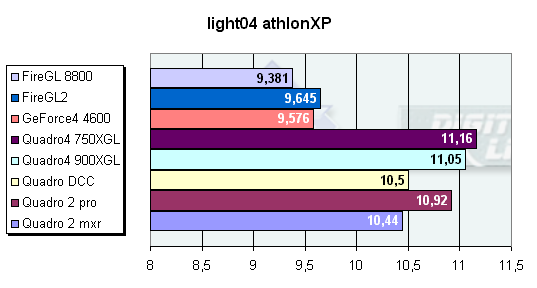
Lightscape Viewset
Четвертый набор тестов Lightscape Viewset или сокращенно light-04.
Вот описание этого теста:
Lighting
The most significant feature of Lightscape is its ability to accurately simulate global illumination effects. The system contains two integrated visualization components. The primary component utilizes progressive radiosity techniques and generates view-independent simulations of the diffuse light propagation within an environment. Subtle but significant effects are captured, including indirect illumination, soft shadows, and color bleeding between surfaces. A post process using ray tracing techniques adds specular highlights, reflections, and transparency effects to specific views of the radiosity solution.

Interactivity
Most rendering programs calculate the shading of surfaces at the time the image is generated. Lightscape's radiosity component precalculates the diffuse energy distribution in an environment and stores the lighting distribution as part of the 3D model. The resulting lighting "mesh" can then be rapidly displayed. Using OpenGL display routines, Lightscape takes full advantage of the advanced 3D graphics capabilities of SGI workstations or PC-based OpenGL-compliant graphic acceleration boards. Lightscape allows you to interactively move through fully simulated environments.
Progressive Refinement
Lightscape utilizes a progressive refinement radiosity algorithm that produces useful visual results almost immediately upon processing. The quality of the visualization improves as the process continues. In this way, the user has total control over the quality (vs. time) desired to perform a given task. At any point in the solution process, users can alter the characteristic of a light source or surface material and the system will rapidly compensate and display the new results without the need for restarting the solution. This flexibility and performance allow users to rapidly test various lighting and material combinations to obtain precisely the visual effect desired.
There are four tests specified by the viewset that represent the most common operations performed by the Lightscape Visualization System:
| Test | Weight | Lightscape functionality represented |
|---|---|---|
| 1 | 25% | Walkthrough wireframe rendering of "Cornell Box" model using line loops with colors supplied per vertex. |
| 2 | 25% | Full-screen walkthrough solid rendering of "Cornell Box" model using smooth-shaded z-buffered quads with colors supplied per vertex. |
| 3 | 25% | Walkthrough wireframe rendering of 750K-quad Parliament Building model using line loops with colors supplied per vertex. |
| 4 | 25% | Full-screen walkthrough solid rendering of 750K-quad Parliament Building model using smooth-shaded z-buffered quads with colors supplied per vertex. |
И теперь давайте посмотрим на результаты нашего тестирования.

medMCAD-01 Viewset
Пятый набор тестов medMCAD-01 Viewset или сокращенно medMCAD-01.
Вот описание этого теста:

Unlike other viewsets, the medMCAD-01 viewset is a 'generic' viewset i.e. it is representative of a class of applications rather than a single application. The medMCAD-01 viewset is intended to model the graphics performance of a range of medium scale, immediate mode, MCAD applications such as Pro/ENGINEER™ from PTC and SolidWorks from SolidWorks Corporation.
The viewset consists of twelve tests, each of which represents a different mode of operation. Four of the tests use a wireframe model, and the other tests use a shaded model. All tests use immediate mode and vertex arrays (glDrawArrays). Each test has two runs: a) with orthographic projection, and b) with perspective projection, zoom and pan (walkthru). Each test returns a result in frames per second, and a composite score is calculated as a weighted geometric mean of the individual test results. The tests are weighted to represent the typical proportion of time a user would spend in each mode.
This viewset uses new features that require SPECviewperf!" 6.1.2.
The shaded model uses 47,000 triangle strips with approximately 444,000 vertices resulting in 349,000 triangles total. There are no discrete triangles. The average triangle screen area is approximately 17 pixels. The maximum depth complexity is 34 with an approximate mean depth complexity of 8.
The wire frame model consists of 26,500 line strips, with around 192,000 vertices giving 120,000 lines total. The mean line length is 7 pixels.
The wireframe tests use aliased lines, since these still are the default for many immediate mode MCAD applications. The shaded tests use either one ore two infinite lights with normalization enabled. Lighting is single sided. There is no texture mapping. See the script files for more information.

| Test | Weight | Description |
|---|---|---|
| 1 | 10 | Wireframe test, no Z, orthographic projection |
| 2 | 10 | Wireframe test, no Z, perspective projection, walkthrough |
| 3 | 10 | Wireframe test, color-per-primitive, Z, user clipplane test, orthographic projection |
| 4 | 10 | Wireframe test, color-per-primitive, Z, perspective projection, walkthrough |
| 5 | 7.5 | Shaded test, Z, back face removed, orthographic projection |
| 6 | 7.5 | Shaded test, Z, user clipplane, perspective projection, walkthrough |
| 7 | 7.5 | Shaded color-per-primitive test, Z, back face removed, orthographic projection |
| 8 | 7.5 | Shaded color-per-primitive test, Z, back face removed, perspective projection, walkthrough with screen door transparency |
| 9 | 7.5 | Shaded color-per-vertex test, Z, back face removed, orthographic projection. |
| 10 | 7.5 | Shaded color-per-vertex test, Z, user clipplane, perspective projection, walkthrough |
| 11 | 7.5 | Shaded test with two infinite lights, Z, back face removed, orthographic projection |
| 12 | 7.5 | Shaded test with two infinite lights, Z, back face removed, perspective projection, walkthrough |
И теперь давайте посмотрим на результаты нашего тестирования.


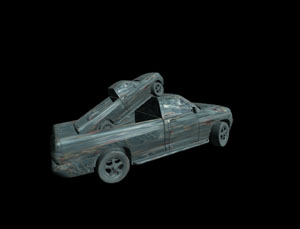
ProCDRS-03 Viewset
Шестой и последний набор тестов ProCDRS-03 Viewset или сокращенно ProCDRS-03.
Вот описание этого теста:
The ProCDRS-03 viewset is an update to ProCDRS-02 (which was a complete update of the CDRS-03 viewset). It is intended to model the graphics performance of Parametric Technology Corporation's CDRS industrial design software.
The viewset consists of ten tests, each of which represents a different mode of operation within CDRS. Two of the tests use a wireframe model, and the other tests use a shaded model. Each test returns a result in frames per second, and a composite score is calculated as a weighted geometric mean of the individual test results. The tests are weighted to represent the typical proportion of time a user would spend in each mode.
The model data was converted from OpenGL command traces taken directly from the running CDRS software, and therefore preserves most of the attributes of the original model.
This viewset uses features that require SPECviewperf™ 6.1.2.
The new ProCDRS-03 viewset doubles the display list size by adding a second truck to the frame. The triangle and line counts increased accordingly.
The shaded model is a mixture of triangle strips and independent triangles, with approximately 562,000 vertices in 9,300 OpenGL primitives, giving 262,000 triangles total.
The wire frame model consists of only line strips, with around 404,000 vertices in 37,000 strips, giving 388,000 lines total.
All tests run in display list mode. The wireframe tests use anti-aliased lines, since these are the default in CDRS. The shaded tests use one infinite light and two-sided lighting. The texture is a 512 by 512 pixel 24-bit color image. See the script files for more information.

| Test | Weight | Description |
|---|---|---|
| 1 | 25 | Wireframe test |
| 2 | 25 | Wireframe test, walkthrough |
| 3 | 10 | Shaded test |
| 4 | 10 | Shaded test, walkthrough |
| 5 | 5 | Shaded with texture |
| 6 | 5 | Shaded with texture, walkthrough |
| 7 | 3 | Shaded with texture, eye linear texgen (dynamic reflections) |
| 8 | 3 | Shaded with texture, eye linear texgen, walkthrough |
| 9 | 7 | Shaded with color per vertex |
| 10 | 7 | Shaded with color per vertex, walkthrough |
И теперь давайте посмотрим на результаты нашего тестирования.
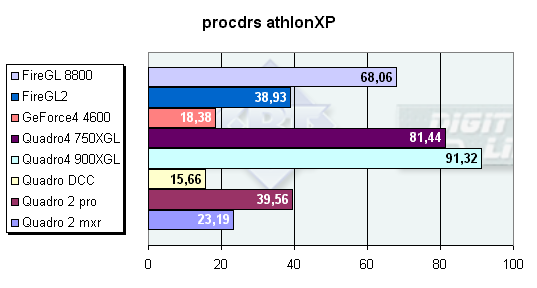
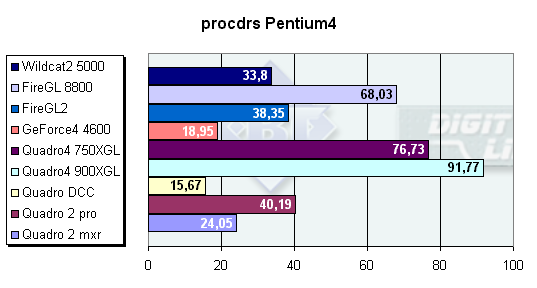
Можно порадоваться за FireGL 8800. Достаточно уверенно выходит на третью позицию, после линейки карт на базе Quadro4.
И, как бы подытоживая результаты, я хочу сложить полученные fps в одну общую корзину и посмотреть, кто же лучший:

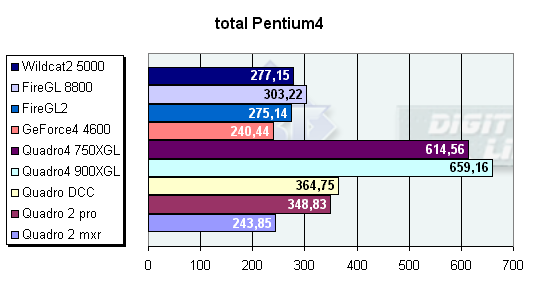
Да, это тяжелые профессиональные тесты. Как результат — мощнейший игровой ускоритель плетется в конце. Я думаю, что к данным диаграммам мои комментарии будут просто неуместны, поэтому перейдем сразу к окончательным выводам.
Выводы
И настало время расставить точки над i.
В этих тестах безоговорочное лидерство за продуктами от NVIDIA. Новейшие Quadro4 с очень большим отрывом впереди. Несмотря на синтетичность этих тестов, наше тестирование в 3D MAX подтверждает, что из всех исследованных карт Quadro4 являются самыми-самыми. Весьма неплохие результаты и у более старшей модели Quadro DCC.
Что касается FireGL 8800, то можно смело сказать, что продукт удался. Удался во всех отношениях. Остается малость — подправить драйвера, чтобы избежать досадных ошибок при работе в 3D MAX. Однако даже в том случае, если драйвера будут поправлены, ATI опоздала примерно на полгода. По идее FireGL 8800 должен конкурировать с Quadro4 750XGL как по цене, так и по производительности. Однако мы видим, что конкурирует он с Quadro4 750XGL, но не так уж и успешно, и с Quadro DCC, а то и с Quadro2 PRO. Прискорбный для ATI факт, но, увы. Однако, еще раз скажу, что карта удалась. Лучше поздно, чем никогда.
Wildcat II 5000 заслуживает отдельного слова. Эта карта показала наиболее стабильные результаты. Этакий середнячок, который без выпендрежа спокойно делает свое дело. А учитывая, что по качеству особых нареканий не возникает, то эту карту можно было бы рекомендовать для использования, но цена... Цена слишком велика за такую производительность, тем более, что за эту же цену можно приобрести более производительный и современный ускоритель.
FireGL2, Quadro2 PRO и Quadro2 MXR остаются в тени своих более старших собратьев. Они делают свое дело, делают в меру быстро, в меру качественно, но отставание с каждым разом всё больше и больше.
Что касается платформ, я бы отметил тот факт, что платформа Intel является наиболее оптимальным выбором для работы с профессиональными приложениями, в то время как платформа AMD больше подходит для игр. В дальнейших наших исследованиях мы не будем более использовать стенд на базе процессоров AMD. По-крайней мере, до тех пор, пока не появится оптимизация профессиональных приложений именно под эти процессоры.
| 10 апреля 2002 2002 г. |
|
|